Add Context and Insights to Search Console with Annotations
Blog
Google update Boost Search Console insights with custom annotations
Google has update a feature in Search Console that lets you drop custom annotations right onto your performance charts. This is not just a minor tweak. For anyone serious about SEO, it’s a way to connect what you did (site changes, campaigns, fixes) with how your traffic behaved. That context can make all the difference.
What are Search Console custom annotations?
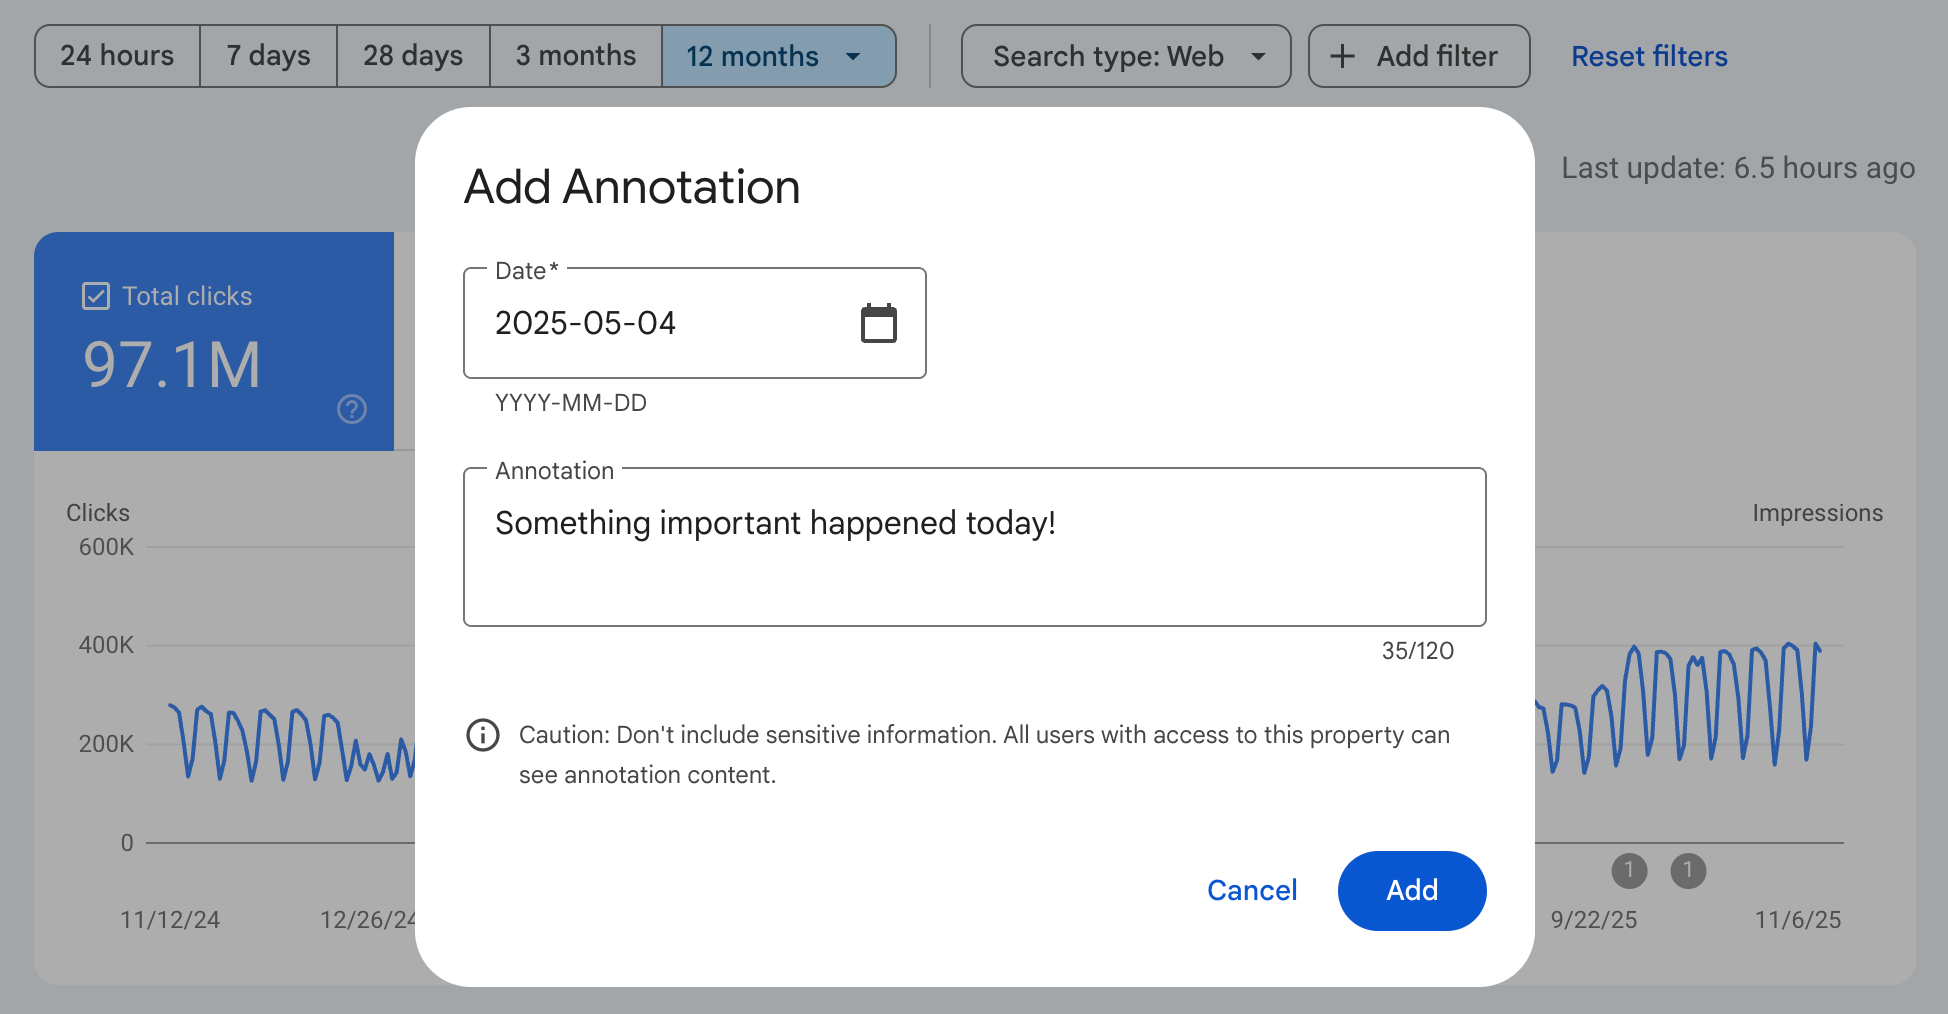
You can now add notes on specific dates directly in the performance chart of Google Search Console. These are simple markers on your chart, but they carry meaning . You can explain what happened (site migration, a big content push, bug fix, etc.). The notes are visible to anyone who has access to that Search Console property, which is great for team collaboration and shared SEO reporting. The design is lightweight , it does not overwhelm the chart, but gives you that valuable layer of context.
Why this matters for SEO
What this really means is your Search Console data stops being just numbers. With annotations, you can:
- Explain traffic spikes: Whenever there’s a sudden jump or dip in clicks or impressions, you can mark what might have caused it.
- Track site updates with clarity: If you refreshed your business website, migrated your domain, or changed your internal linking. You can make note of it.
- Impact of SEO work: Over time, you will build a timeline in your performance chart showing how your efforts (or external factors) align with performance changes.
- Improve reporting: When you pull out monthly or quarterly SEO reports, annotated charts let you say “This drop was because of X” instead of guessing.
- Alignment with your team: Everyone from your team content writers, SEOs, developers . Can look at the same chart and understand what was done and why.
How to use Search Console annotations?
How can you start making these annotations work for you? Here is the points
- Open your Performance report in Google Search Console.
- On the performance chart, find the “Add annotation” option , often via right-click on the chart or a dedicated UI button.
- Choose the date or date range you want to annotate.
- Write a short (up to ~120 character) note describing what event happened and why it matters.
- Save it. You will now see a small marker on your chart for that date.
- Later, you (or your teammates) can click or hover over that marker to read, edit, or delete the annotation.
Best way for using annotations in Search Console
- Be consistent: Use a naming according to your work. For example, “Content Update on July05” or “Migrate the URL on Sep2025”.
- Make it clean and easy to understand others : The note does not need to be long , and ideally just enough to remind you later what you did and why.
- Annotate significant events: Not every tiny tweak but any change that could influence traffic, think content pushes, campaigns, server issues.
- Do not forget team visibility: Make sure other stakeholders know to check and add annotations too.
- Review your annotations periodically: Once a month or quarter, go through your markers and make sure they still make sense in light of your SEO data.
Things to watch out for
- Since this is a relatively new rollout, you might not have access immediately. The feature is being introduced gradually.
- The annotations do not change your data. They do not affect clicks or impressions. They purely provide context.
- Avoid over-annotating. Too many notes can clutter your chart and make it hard to extract meaning.
- Be cautious about what you write. Because other users on your team can see annotations, avoid putting in sensitive or personal information.
Why is this a smart move for Google and SEOs ?
Here’s why this feels like a meaningful upgrade:
- SEO is not just about raw numbers — real-world changes (content updates, migrations, campaigns) matter a lot.
- Teams working on SEO need a way to link their actions directly to performance.
- Having this native annotation feature reduces reliance on external tools or spreadsheets just to track what happened when.
If you start using annotations in Search Console well, you will soon find your performance chart is less a static graph and more a narrative of your SEO journey. It’s not just about what happened. It’s about why it happened.
